Note
Go to the end to download the full example code.
Pair distribution functions#
Calculate the pair distribution function G(r) with diffuse.pdf():
how a finite Q range adds termination ripples, and how X-rays and neutrons
weight the atom pairs differently.
To run it yourself, from the repository root:
DIFFUSE_PYTHON_PATH=build/python PYTHONPATH=python python3 python/examples/pdf_demo.py
from pathlib import Path

import matplotlib.pyplot as plt

import diffuse as dc
Nickel: the effect of a finite Q range#
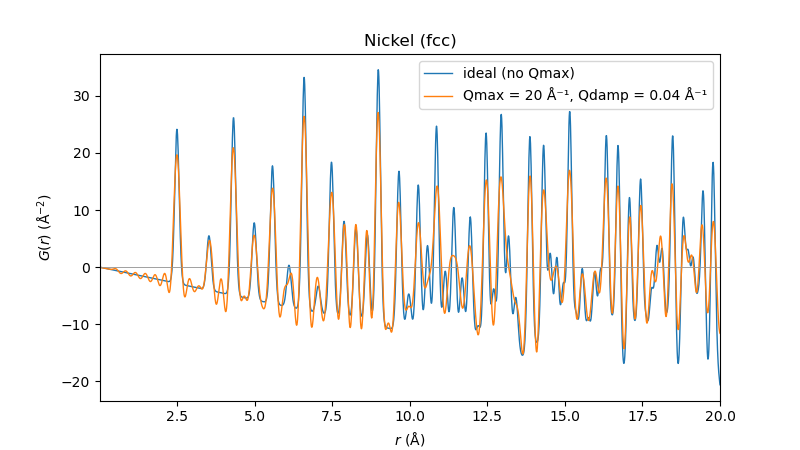
qmax=0 gives the PDF of an ideal measurement. A real one stops at
some Qmax, which adds ripples around each peak; qdamp describes the
instrument resolution, which damps the peaks at large r.
nickel = dc.read_structure(HERE / "nickel.cell")
ideal = dc.pdf(nickel, rmax=20, dr=0.01)
measured = dc.pdf(nickel, rmax=20, dr=0.01, qmax=20, qdamp=0.04)

ax = ideal.plot(label="ideal (no Qmax)")
measured.plot(ax=ax, label="Qmax = 20 Å⁻¹, Qdamp = 0.04 Å⁻¹")
ax.set_title("Nickel (fcc)")
ax.legend()
<matplotlib.legend.Legend object at 0x7f8556d0da90>
The first peak sits at the nearest-neighbour distance a/√2:
first peak at r = 2.490 Å, a/√2 = 2.491 Å
Anatase: X-rays and neutrons#
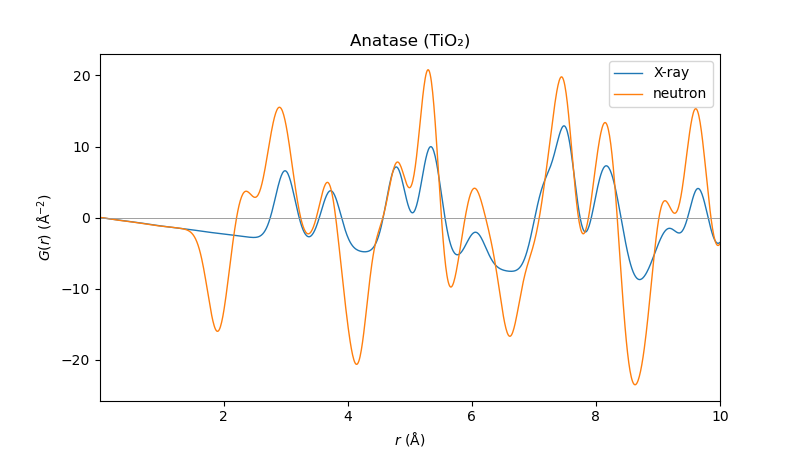
Each atom pair is weighted by the scattering power of its two atoms. Titanium dominates for X-rays; for neutrons its scattering length is negative, so Ti–O peaks point down.
anatase = dc.read_structure(HERE / "anatase.cif")
xray = dc.pdf(anatase, rmax=10, dr=0.01, qmax=25, radiation="xray")
neutron = dc.pdf(anatase, rmax=10, dr=0.01, qmax=25, radiation="neutron")

fig, ax = plt.subplots(figsize=(8, 4.5))
xray.plot(ax=ax, label="X-ray")
neutron.plot(ax=ax, label="neutron")
ax.set_title("Anatase (TiO₂)")
ax.legend()

plt.show()
Total running time of the script: (0 minutes 0.212 seconds)